
Coors Field sits 5,280 feet above sea level, creating baseball’s ultimate science experiment. No other park fundamentally alters the game’s physics like this concrete laboratory in Denver’s thin air.
When the ballpark opened in 1995, we witnessed offensive explosions that made the steroid era look quaint. Now, after nearly three decades of data, fantasy baseball players adjust player valuations by up to 20% for Coors games. This isn’t just another park factor; it’s baseball on a different planet.
8. Physics Gone Wild
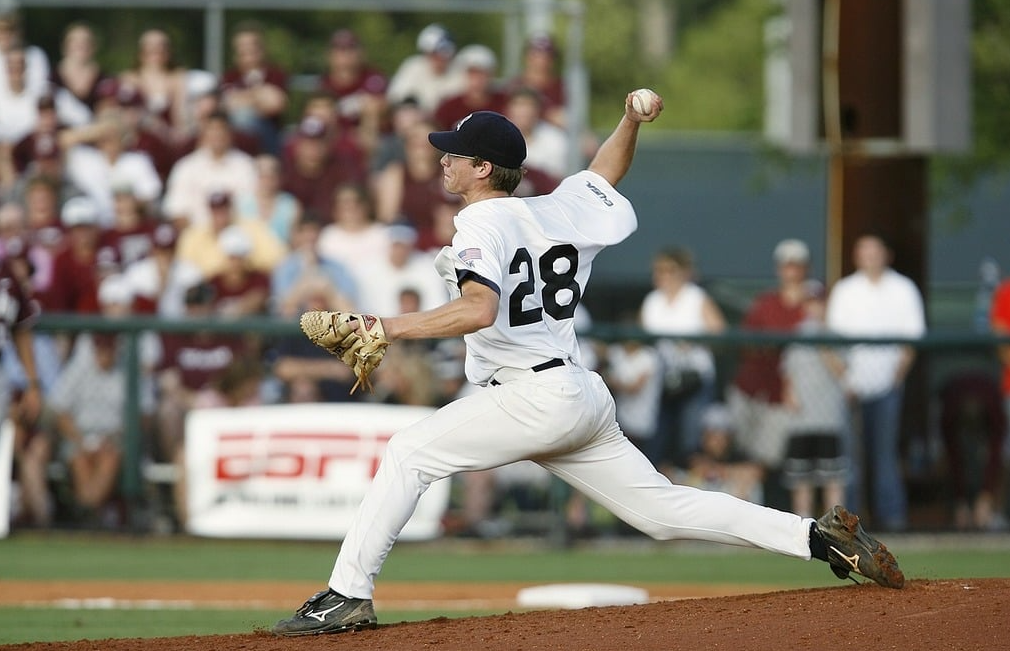
Denver’s air density sits roughly 20% lower than sea level. A warning-track out elsewhere becomes a souvenir at Coors. The thin air turns routine fly balls into home runs and doubles into triples.
The less obvious effect? Pitches behave like rebellious teenagers. Breaking balls refuse to break. Curveballs flatten. Sliders slide sideways rather than down. Summer months amplify these effects as temperatures rise. No pitcher arrives in Denver without dreading what altitude will do to their arsenal.
7. Stat Sheet Explosion
The numbers at Coors read like a video game with cheat codes. Batting average: .296 versus .259 league-wide. On-base percentage: .354 versus .330. Slugging percentage: .487 compared to .416. These aren’t small differences—they’re statistical earthquakes.
Even after the Rockies introduced the humidor in 2002, offense remained supercharged. While other “hitter-friendly” parks boost offense by 5-7%, Coors pushes 20% above league averages. It creates a parallel universe where mediocre hitters look like All-Stars and All-Stars look like MVPs—baseball’s ultimate optical illusion.
6. Pitching Nightmares

Imagine mastering your craft, then watching helplessly as your skills become useless. That’s life for pitchers at Coors. ERAs inflate from 4.29 to 5.62. WHIPs balloon from 1.35 to 1.56. Strikeouts plummet from 19% to 16.95%.
German Márquez represents the rare success story by adapting rather than fighting conditions. He emphasizes fastball-slider combinations while minimizing his curveball. The mental game matters too—successful Coors pitchers accept inflated stats, focus on team wins, and develop different approaches for home versus road games.
5. The Never-Ending Outfield

Coors Field features MLB’s largest outfield—347 feet to left, 415 to center, 350 to right. This deliberate design attempts to counter altitude-driven home runs. The result? Baseball played across multiple zip codes. Outfielders position themselves deeper, creating more landing zones for hits.
During one remarkable 2018 game, Charlie Blackmon covered over 1.2 miles defensively—nearly double what outfielders run elsewhere. The vastness creates a strange contradiction: a homer-friendly park that simultaneously produces more triples than anywhere else in baseball.
4. Triple Trouble
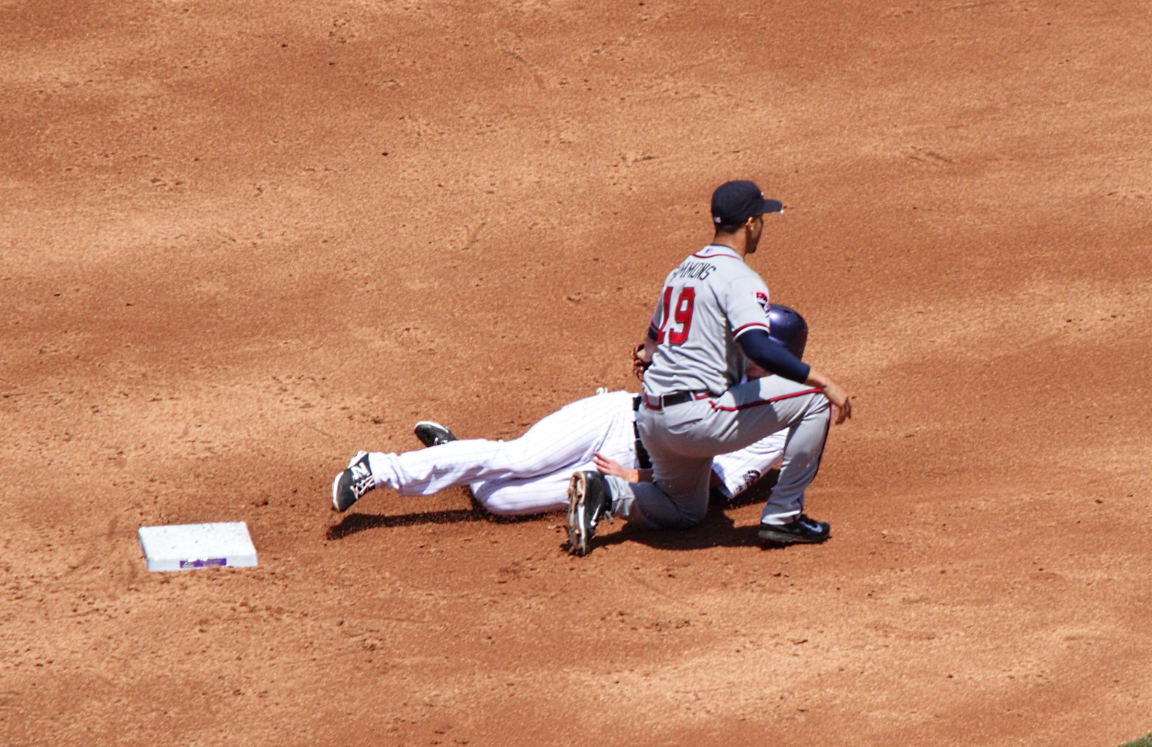
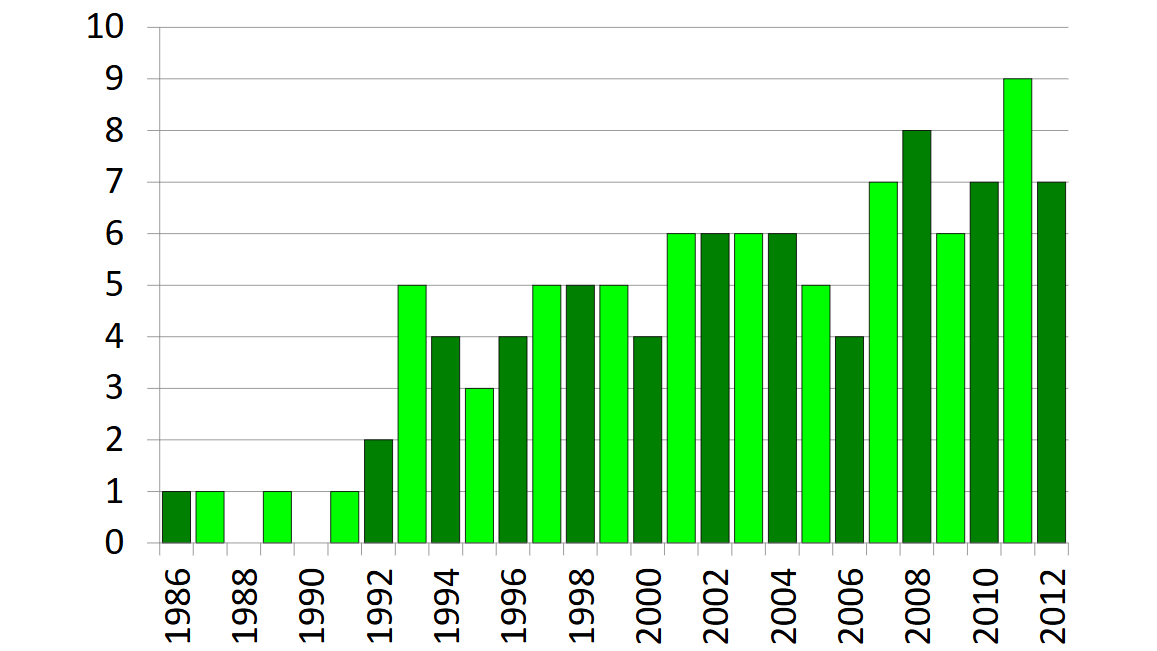
Nothing highlights Coors Field’s bizarro-world status like its triple production. Since 1995, more three-base hits have occurred here than at any other MLB stadium. The park factor for triples stands at 198—players hit nearly twice as many triples here as elsewhere.
This creates a unique tactical environment where speed becomes premium currency. Unlike home runs, which the humidor somewhat tamed, triple rates remain stubbornly high. The combination of thin air and endless outfield creates baseball’s perfect triple storm, turning slap hitters into extra-base threats with every contact.
3. Hall of Fame Headaches
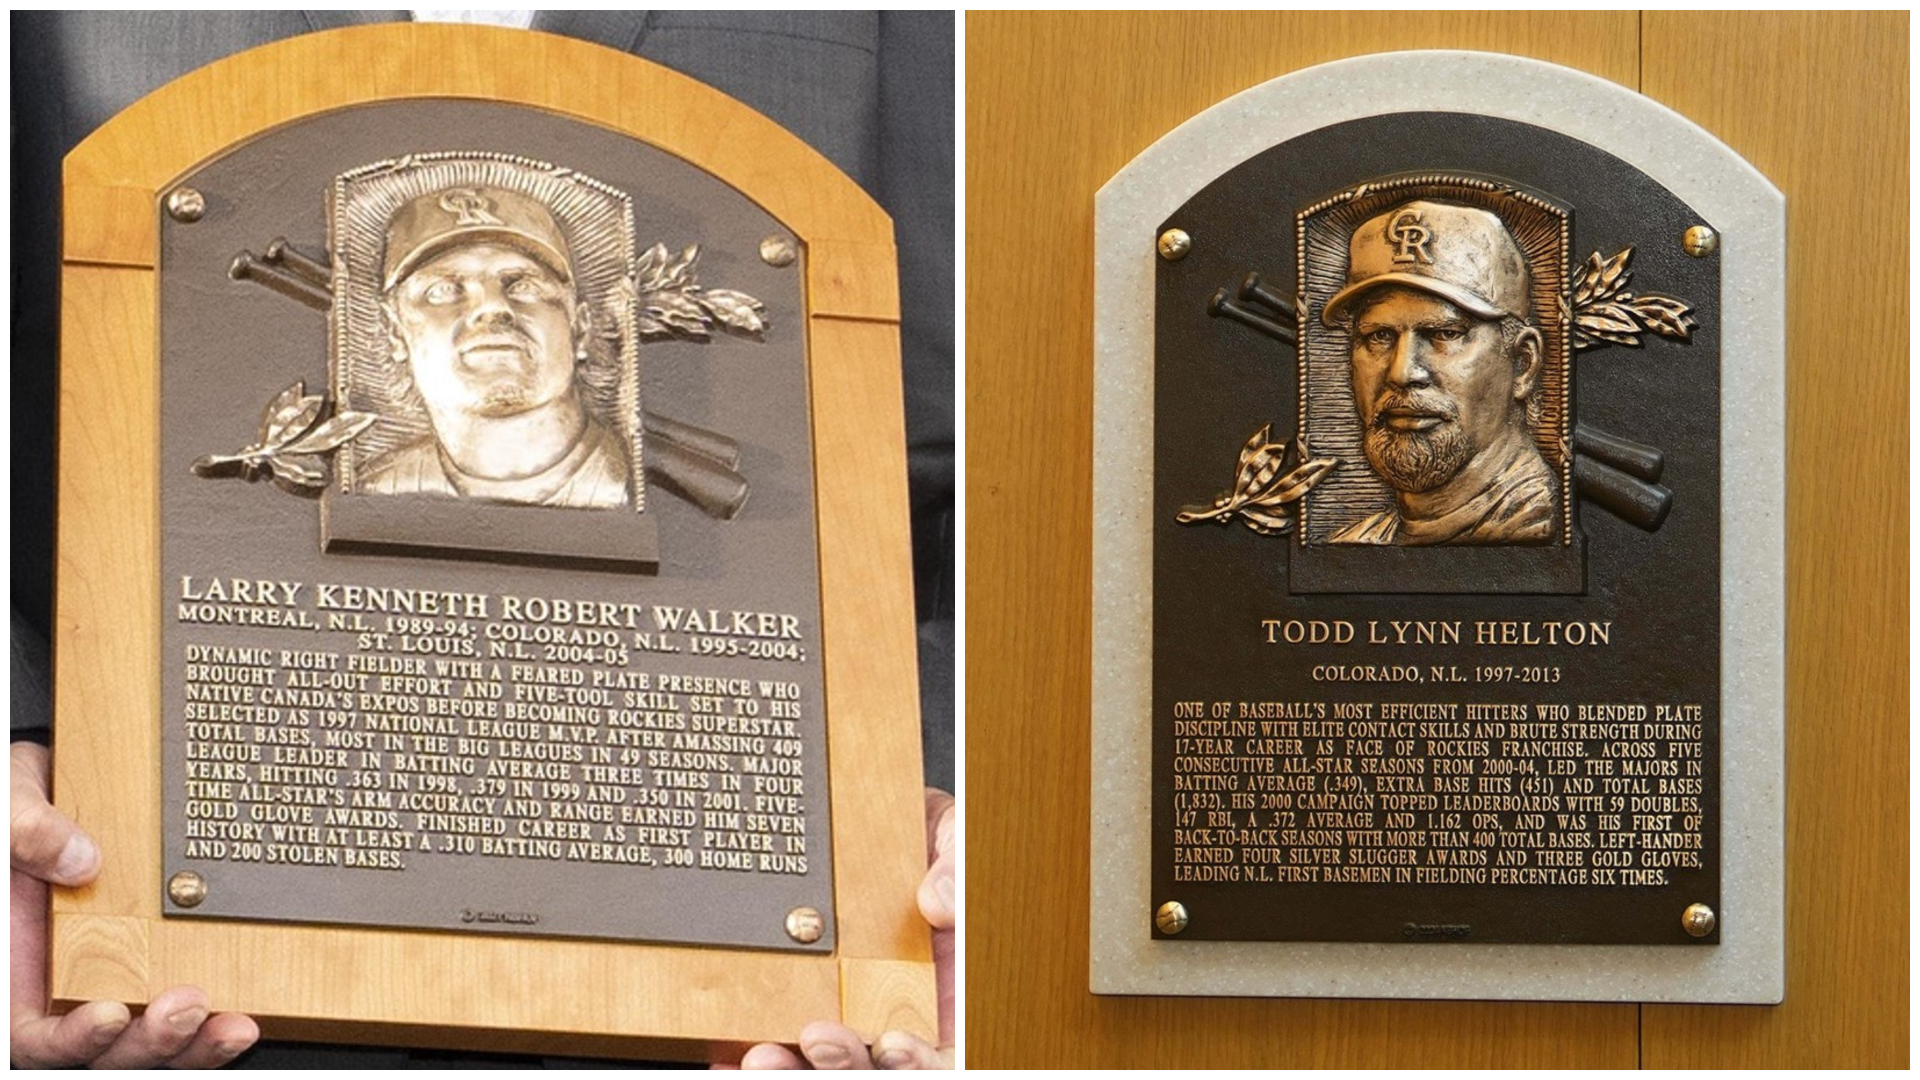
Larry Walker needed all 10 ballot years before Cooperstown called. Todd Helton waited 6 years. Both delays stemmed from “Coors Field skepticism”—voters discounting inflated Colorado numbers. The Coors Effect creates evaluation challenges no other park does.
Modern analytics have gradually changed this conversation. Park-adjusted metrics like OPS+ and WAR reveal these players were exceptional regardless of altitude. Walker’s votes jumped from 21.9% in 2011 to 76.6% by 2020. Future Rockies candidates will likely face initial skepticism before gradual acceptance as voters increasingly trust advanced metrics.
2. The Coors Field Hitter Blueprint

Building a lineup for Coors requires specialized knowledge. Contrary to intuition, pure power hitters aren’t the answer. The ideal Coors batter combines contact skills (strikeout rate below 25%), a line-drive approach, decent speed, and pull-side power.
Players who struggle at Coors typically fall into two categories: extreme fly ball hitters who don’t adjust to outfield depth, and high-strikeout sluggers who can’t capitalize on contact advantages. Scouts now track line-drive percentage and opposite-field approach as key success predictors. The myth of the Coors Field slugger gives way to the Coors Field technician.
1. Defense Wins Championships (Even at Coors)
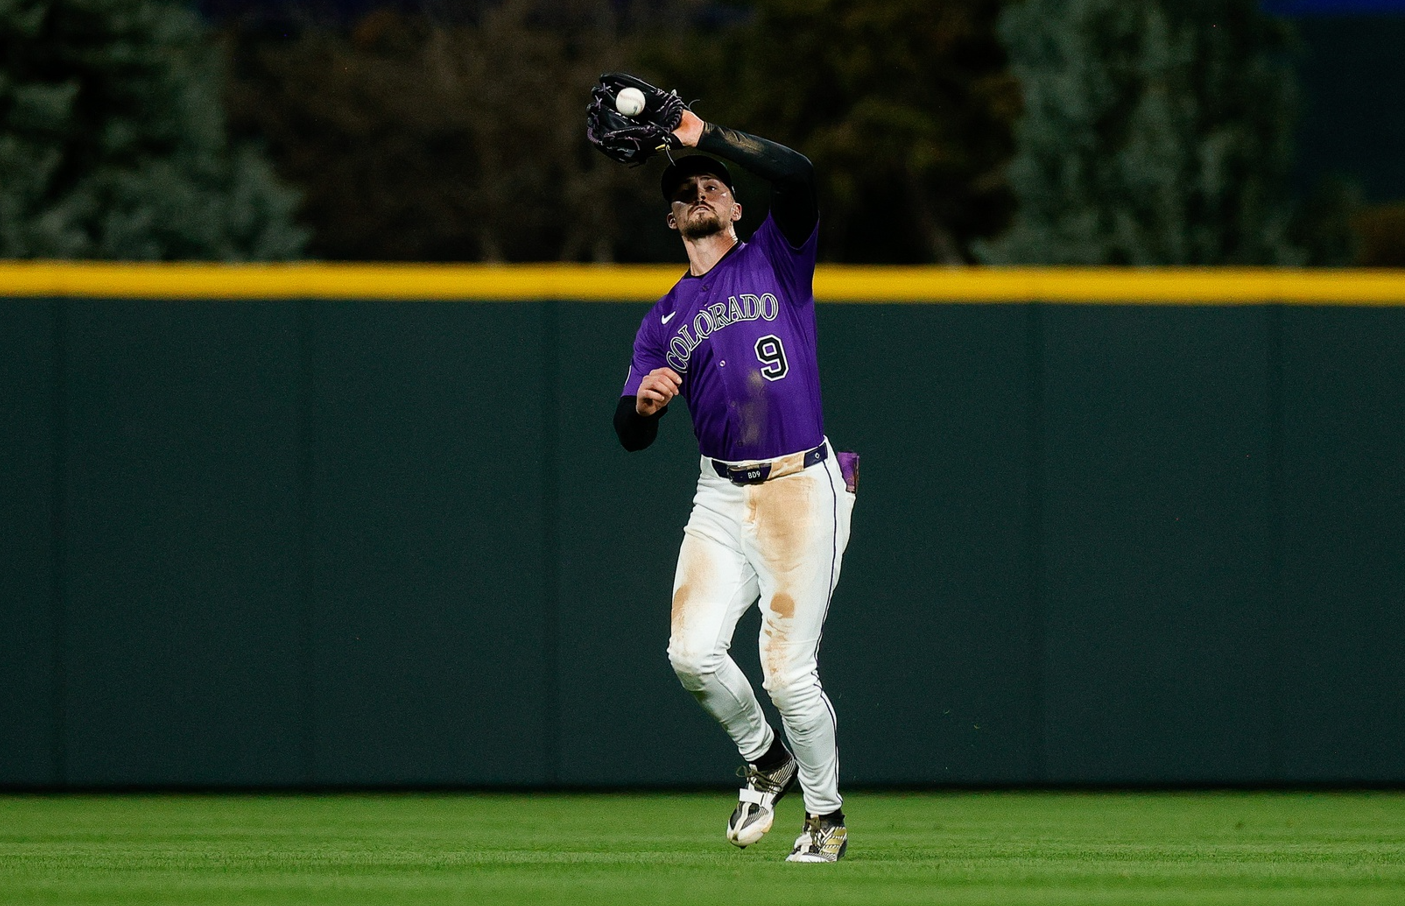
Elite outfield defense matters more at Coors than anywhere else. One defensive run saved translates to approximately 1.4 runs in the standings—a 40% premium compared to other parks. Without defensive wizards patrolling that grass, pitchers stand no chance.
The most competitive Rockies teams featured outfielders with exceptional speed and route efficiency. Remember the 2007 World Series team? Their outfield covered more ground than Lewis and Clark. Teams investing heavily in outfield defense have seen pitching staff ERAs improve by as much as half a run—the baseball equivalent of finding water in the desert.


